Webhook Infrastructure Performance Monitoring, Scalability Tuning and Resource Estimation
The true test of reliability for any solution handling webhooks is the ability to maintain high levels of performance regardless of the volume of webhooks it handles. As your system is placed under the pressure of an increasing webhook workload, network traffic and the amount of data that needs to be processed increases which causes resources to be used up at a faster rate. This is followed by a degradation of the system’s performance and oftentimes a system shutdown.
Without proper monitoring instrumentation of your webhook processing system, it can be very difficult to investigate performance bottlenecks, which in turn frustrates the remediation process.
In this article, we will use the proposed webhook solution from our series to demonstrate how performance monitoring can be set up. We will then go further to show how you can set Key Performance Indicators (KPIs) for your webhook solution that can help in estimating the resources required to meet your performance targets.
Understanding how to monitor the performance of our webhook solution
The ability to determine if the performance of our webhook solution is good or poor first requires that we have a good understanding of the level of performance at which the system should be capable of running.
The webhook solution is made up of various components and its overall performance depends on the performance of each component. When a component fails, the performance of the system will most likely decrease. Being able to detect this performance decrease can help us take steps to resolve the problem and more proactive steps to avoid it in the future.
The performance of each component in the solution, and the system as a whole, depends on a number of factors which are often measured through key performance indicators (KPIs). These KPIs can be direct measurements of a specific component metric or a derived value from a group of metrics. Examples include the number of concurrent webhooks being processed by a consumer, the volume of network traffic to the API gateway, average processing time for webhooks by consumers, etc.
Each component’s capabilities are tied to these metrics and understanding the limitations of each component helps us set thresholds under which the component can operate optimally. For example, a webhook consumer has a limit on how many webhooks it can handle concurrently at any given time based on its resources (memory, I/O, etc.). If this limit is exceeded, the consumer becomes burdened and takes a performance hit (increased latency, increased turnaround time for webhooks, etc.) which can eventually lead to a total shutdown when system resources are used up. Closely monitoring these metrics helps avoid these types of performance reduction and failure scenarios.
When a performance decrease occurs (for example, as a result of an increase in latency for webhooks hitting the API gateway), an administrator should be able to troubleshoot the problem down to the core details. This includes seeing where the bottleneck is, what caused it, what time it started, which component is the actual source of the bottleneck, and how the issue is affecting the overall performance of the system.
What are the requirements for monitoring the performance?
Performance measurement requires observing the system while it’s functioning under a typical production-type load and capturing data for each KPI over a period of time. Running the system under this simulated load in a test environment helps engineers gather appropriate data before deploying the solution to production.
High level metrics
To examine the performance of the webhook solution, it is important to capture the following types of high-level metrics for each component and/or the system as a whole:
- The response rate after receiving a webhook.
- The number of concurrent webhooks being handled.
- The volume of network traffic to a component.
- The rate at which a component completes its job (throughput).
- The average processing time for each webhook.
It is also beneficial to employ monitoring tools that can help administrators identify relationships between metrics being collected. For example:
- The correlation between the number of concurrent webhooks and webhook latency (how long it takes to start processing a webhook after it is received).
- The correlation between the number of concurrent webhooks and the average response time (how long it takes to complete the processing of a webhook by a consumer).
- The correlation between the volume of webhook requests and the number of processing errors, etc.
High-level metrics are great and they give a quick overview of the problem and its effect on the system. However, when it comes to troubleshooting problems, low-level metrics obtained from resource utilization at the component level are key to resolving the problem.
Low-level metrics
Alongside high-level functional information, administrators should be able to have detailed information about the performance of each component in the system. This type of information is mostly available through low-level metrics, such as:
- CPU processing time
- Number of threads being used
- Memory usage
- Disc write I/O rates and errors
- Network I/O rates and errors
- Message queue length
Note that this is just a brief list of the types of metrics we should be looking at capturing. Later in the article, we will focus on metrics for each component in our webhook infrastructure.
Visualization of metrics
An intuitive visualization dashboard is also a very important requirement for effectively monitoring the performance of our webhook solution. This visualization helps administrators make sense of the data and relate data.
All visualizations should also allow an administrator to select a time period for their query. The displayed data can either give a snapshot of the current state of the system’s performance or a historical view.
Operators should also be able to configure alerts based on performance measures for any metric (direct or derived) during a specified time interval.
How to capture performance metrics
Performance metrics can be gathered using monitoring tools like Prometheus. Metrics collectors are often deployed as background processes gathering usage information as the system runs.
For example, Prometheus has client libraries for Node.js, Ruby, Python, and more. These libraries help add instrumentation to your code and can be configured to collect the types of metrics that are critical to your monitoring needs.
You can also add trace statements, along with timing information, at key points in the application code for components like the rate-limiter and webhook consumers. This is why we added a Trace ID at the API gateway to each webhook in order to track it.
The Trace ID can be used in tracing logic that captures faults, exceptions, and warnings, and correlates them with the webhooks or events that caused them.
Another best practice in performance monitoring is capturing performance data for any external systems used in the webhook solution. For example, let’s assume we are using an external service like Amazon API Gateway to provision our webhook gateway component, we can pull performance metrics from metrics endpoints provided by the service.
If the external service does not expose any endpoint for collecting metrics, we can record information such as the start time and end time of each webhook request made to the external service. We can also capture the rate of failure or success of the operations of the external service.
How to analyze the performance data
Analyzing performance involves the aggregation of raw data and the use of mathematical/statistical formulas to transform the data into information that presents an accurate picture of the state of the system.
Much of the analysis work involves querying relevant data, and relating and translating them into information that indicates performance insights like:
- Operational throughput
- Anomalies in resource utilization
- Rate of errors between network calls (and other I/O operations), webhook processing, etc.
This information can be captured at the component level or for the overall system. To make the analysis result intuitive, the data points from the test are presented through visualizations such as tables, graphs, or numeric percentiles. This enables administrators to easily extract useful insights from the analysis.
Every form of performance analysis starts with putting your webhook infrastructure under an expected amount of load via load-testing. As you load-test, you collect performance data and pass them through analytical formulas that produce values indicating the performance of your webhook infrastructure.
There are different types of results you can produce that indicate the performance of your system. However, based on best practices, the following are key:
- Averages: Averages are arrived at by adding up all values in a data set and dividing the sum by the total number of values. Averages can be used to analyze metrics such as average response time for each webhook. One of the drawbacks of using averages is that they often contain a few outliers within the data set, so be careful when using them to judge performance.
- Standard deviation: This is a measure of how much the values in a data set vary with respect to their average or how far apart they are. Let’s assume that you’re getting an average response time of 3 seconds per webhook, which is below a timeout limit of 5 seconds so you assume you’re fine. However, you still get timeout errors for your webhooks. You then check your response time calculation and see that your average is made of the following values: 1, 1, 7. This indicates that the deviation of the last value is far off the average, which explains the error.
- Percentiles: A percentile gives a measure under which a percentage of the sample size is found. For example, the 90th percentile (P90) indicates that 90% of the data set is below a fixed threshold while the remainder (the other 10%) is above it. Percentiles are a better indicator for how well your system is performing under a specified amount of load, and it is possible to calculate percentiles for varying sample sizes. For example, P95 AND P99 show the performance of a certain metric with 95% and 99% of the data set respectively.
Example
Let’s take a look at an example of how performance can be analyzed using some of the metrics that can be collected in our webhook infrastructure. For this example, we will try to analyze the performance of our webhook ingestion, i.e. the operation of the message broker.
Two types of metrics that can be collected from the broker are:
- Messages published into a queue
- Messages published out of a queue
These two are measured as a rate (per second). So, we place our webhook infrastructure under a specific load and measure these metrics until all of the webhooks are processed. Next, we plot the values on a graph over the course of time that the test ran and we get the result below:
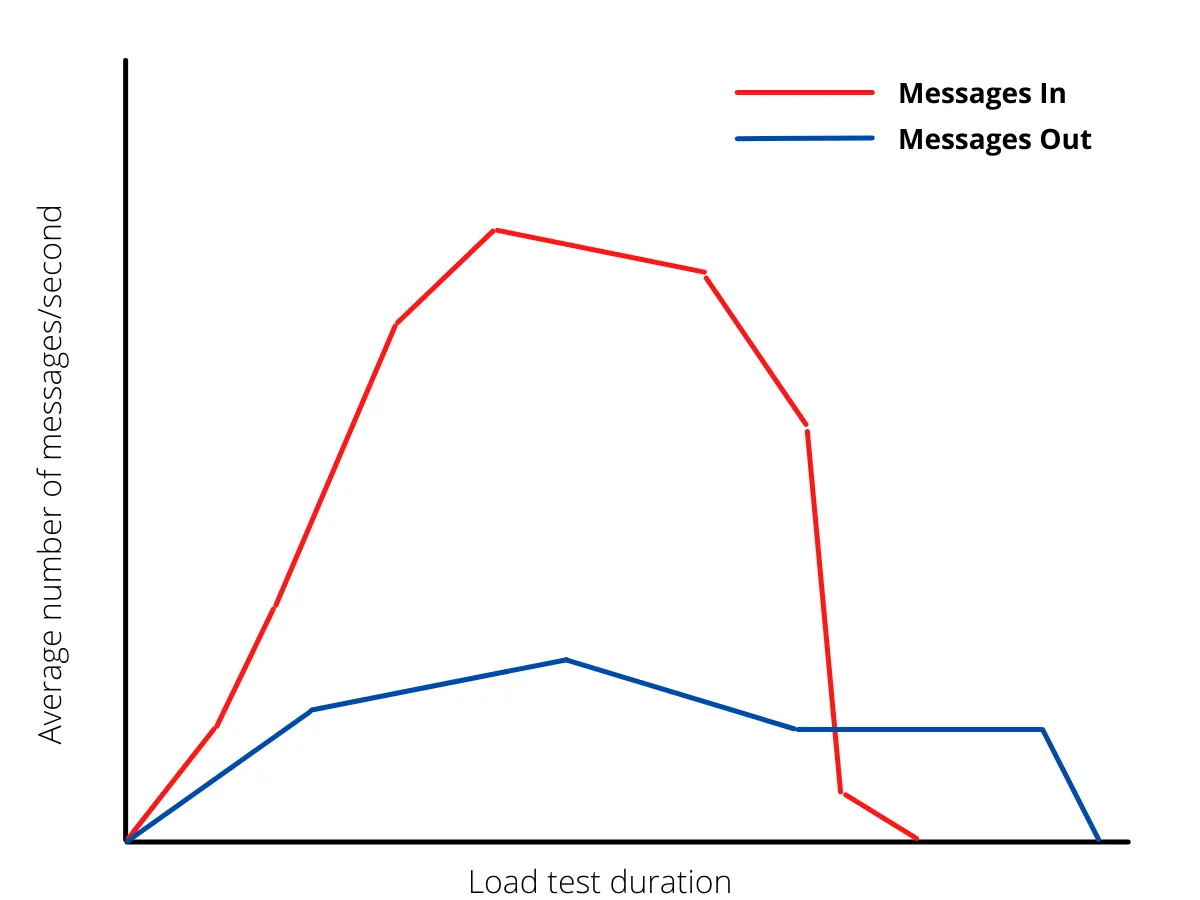
As seen from the diagram, the incoming messages increase and reach a peak before dropping to zero at the end of the test. However, the outgoing messages tried to keep up at the beginning, peaked early and the throughput simply degraded over time with messages still being consumed after the load test is finished.
A “perfectly” performing ingestion process will result in a graph where both lines are aligned. Optimal performance will have the deviation between the two lines at a reasonable minimum. One of the ways to achieve this is by introducing more parallelism to message processing.
An anomaly that results in the blue line being above the red line while messages are still moving into the queue at a high rate indicates that a substantial amount of messages are being dead-lettered. This shows a possible high rate of errors in message consumption. These errors can be a result of CPU or memory exhaustion, insufficient message lock durations, etc.
KPIs and resource estimation
As stated earlier, to determine if a system is performing optimally or poorly, you first have to set performance targets. These performance targets should be based on business operations, with more focus on customer-facing tasks.
In standard practice, these targets are presented in the form of Key Performance Indicators (KPIs). Examples of KPIs include, but are not limited to:
- Latency or response time of specific requests (e.g. response time for each webhook published by a webhook producer, this limit is to be set below the timeout limit defined by the producer).
- The number of requests performed per second (do you want to process 10k, 100k, or a million webhooks per second?).
- The rate at which the system generates errors (e.g. less than 4% errors per million webhooks).
With these indicators, you can appropriately judge, through testing, if your system is performing optimally or not.
Keep in mind that every performance target must explicitly include a target load. For example, when trying to operate below a 4% error rate, this value has to be tied to a specified volume of webhooks being processed (e.g. 25k/second).
This is why it is important to have Service Level Objectives (SLOs) that define performance targets tied to workload, for example:
Webhook requests will have a response time below 350ms at P90 for loads up to 50k requests/second.
The statement above is a clearly defined criterion for optimal performance with regards to webhook response time, and includes the sample size it affects.
What is resource estimation for webhook infrastructure?
One of the major purposes of performance testing is to be able to estimate the number of resources required to operate at performance targets that have been set.
The process of estimating the resources required can be summarized as follows:
- Implement a simple (MVP-type) version of your infrastructure.
- Load test with the expected production load your system will need to handle.
- Collect metrics and analyze the data.
- Attack one bottleneck at a time. Test a solution by increasing resources and/or tuning configurations.
- Uncover more bottlenecks upstream and downstream and repeat the cycle.
- At the point where you hit your performance targets, you will have arrived at the required resources.
Example of resource estimation for webhook infrastructure
To understand the process better, let’s walk through a sample estimate for our webhook infrastructure. Let’s say we start out with this resource estimation table (please note that this is not a detailed analysis but an example to understand the estimation process):
| Estimations | |
|---|---|
| API Gateway | 1 instance |
| Message Broker | 1 node |
| Webhook Consumer | 1 instance |
Next, we load test our infrastructure with a production-level volume of webhooks and realize an abundance of timeout errors between the producer and the API gateway.
After investigation, we realize that we need to scale out the gateway service so we introduce more instances and arrive at a new estimate:
| Estimations | |
|---|---|
| API Gateway | 4 instance |
| Message Broker | 1 node |
| Webhook Consumer | 1 instance |
We test once again and notice that our broker keeps crashing and restarting. We are not losing messages because we declared our queues to be durable and persistent, however the broker outages are impacting performance negatively with a high turnaround time for webhook processing.
We investigate once again and notice that the memory of the broker is being exhausted at a fast rate. To resolve this, we introduce a cluster containing 3 brokers to spread the load and arrive at a new estimate:
| Estimations | |
|---|---|
| API Gateway | 4 instance |
| Message Broker | 3 node |
| Webhook Consumer | 1 instance |
We test once again and notice that only 70% of our webhooks fall within our SLO for webhook turnaround time. Meanwhile, our SLO states that 95% of webhooks should be processed within 150ms. This indicates a degradation in performance over time.
We investigate and notice that our broker is ingesting messages faster than the rate at which messages are being consumed (similar to the problem indicated by the broker performance test graph above).
Knowing this, we decide to introduce more parallelism into our webhook processing by horizontally scaling consumers. This brings us to a new estimate:
| Estimations | |
|---|---|
| API Gateway | 4 instance |
| Message Broker | 3 node |
| Webhook Consumer | 6 instance |
After implementing this we see an improvement, but only for 85% and not 95%. We investigate further and trace the issue down to the processing speed of our consumer’s CPU.
Bumping the CPU capacity up results in an increase in processing time and helps us hit the 95% mark stated in our SLO.
Sometimes, the result of your investigation into performance bottlenecks can lead to the introduction of new components in your infrastructure. For example, you may need to introduce a caching system to speed up the performance or hold temporary data. Other times, you might need to break components down further (for example database sharding).
Conclusion
Performance monitoring is critical to any webhook infrastructure that aims to reliably process webhooks as the volume of webhooks increases.
In this article, we have described how to set up instrumentation for measuring performance, how to analyze the data, and how to use the result for infrastructure provisioning.
Gradually increasing traffic volumes and unexpected traffic spikes are inevitable for fast-growing online businesses. Having a standard performance monitoring setup in place helps to avoid issues that can frustrate user experience and create losses for the business.
Gain control over your webhooks
Try Hookdeck to handle your webhook security, observability, queuing, routing, and error recovery.